Developer-first diagnostics for Rust applications
![]()
I’m excited to start talking more widely about a project I’ve been working on for the last few years. It’s a framework for adding diagnostics to Rust applications called emit. You can use emit to pepper your code with logs, to trace key operations, to surface metric samples, and to produce whatever other kind of diagnostic data you’d like. Its data model is not based on OpenTelemetry. Everything is represented as an event; a time-oriented bag of data described by a message template. That’s enough to build higher-level concepts like traditional log records, spans in a distributed trace, or aggregated samples from some data source over the top. emit’s simplified data model doesn’t make it a low-level diagnostics toolkit. It’s built to offer the right level of abstraction and fidelity for developers of web and CLI applications.
A quick demonstration
emit is made for developers, and developers like code so here’s a quick demonstration of how the framework looks.
You add the base emit library to your Cargo.toml, along with somewhere to emit its diagnostics to. In this example we’re using emit_term, which pretty-prints to the console:
[dependencies.emit]
version = "0.11.0-alpha.5"
features = ["serde"]

[dependencies.emit_term]
version = "0.11.0-alpha.5"
You use emit::setup() to initialize the framework. The #[emit::span] macro traces the execution of a function, correlating any diagnostics emitted within it. The emit::info! macro emits a diagnostic event, capturing any referenced state from its environment:
use std::time::Duration;

#[emit::span("Issue greeting to {id: user.id}")]
fn greet(user: &User) {
    emit::info!("Hello, {#[emit::as_serde] user}!");
}

#[derive(Serialize)]
struct User<'a> {
    id: &'a str,
    name: &'a str,
}

fn main() {
    let rt = emit::setup()
        .emit_to(emit_term::stdout())
        .init();

    greet(&User {
        id: "rustlang",
        name: "Rust",
    });

    rt.blocking_flush(Duration::from_secs(5));
}
When run, the above program will output something like this:

emit isn’t just for pretty console output. It uses the same plugin approach as other diagnostics frameworks to support emitting diagnostics to rolling files, to an OTLP (OpenTelemetry compatible) collector, or anywhere else you might want. Here’s how the example changes if I want to add OTLP support:
[dependencies.emit_otlp]
version = "0.11.0-alpha.5"
fn main() {
    let rt = emit::setup()
        .emit_to(emit_term::stdout())
        .and_emit_to(emit_otlp::new()
            .resource(emit::props! {
                #[emit::key("service.name")]
                service_name: "emit_demo"
            })
            .logs(emit_otlp::logs_grpc_proto("http://localhost:4319")
                .body(|event, f| write!(f, "{}", event.tpl()))
            )
            .traces(emit_otlp::traces_grpc_proto("http://localhost:4319")
                .name(|event, f| write!(f, "{}", event.tpl()))
            )
            .metrics(emit_otlp::metrics_grpc_proto("http://localhost:4319"))
            .spawn()
            .unwrap()
        )
        .init();

    greet(&User {
        id: "rustlang",
        name: "Rust",
    });

    rt.blocking_flush(Duration::from_secs(5));
}
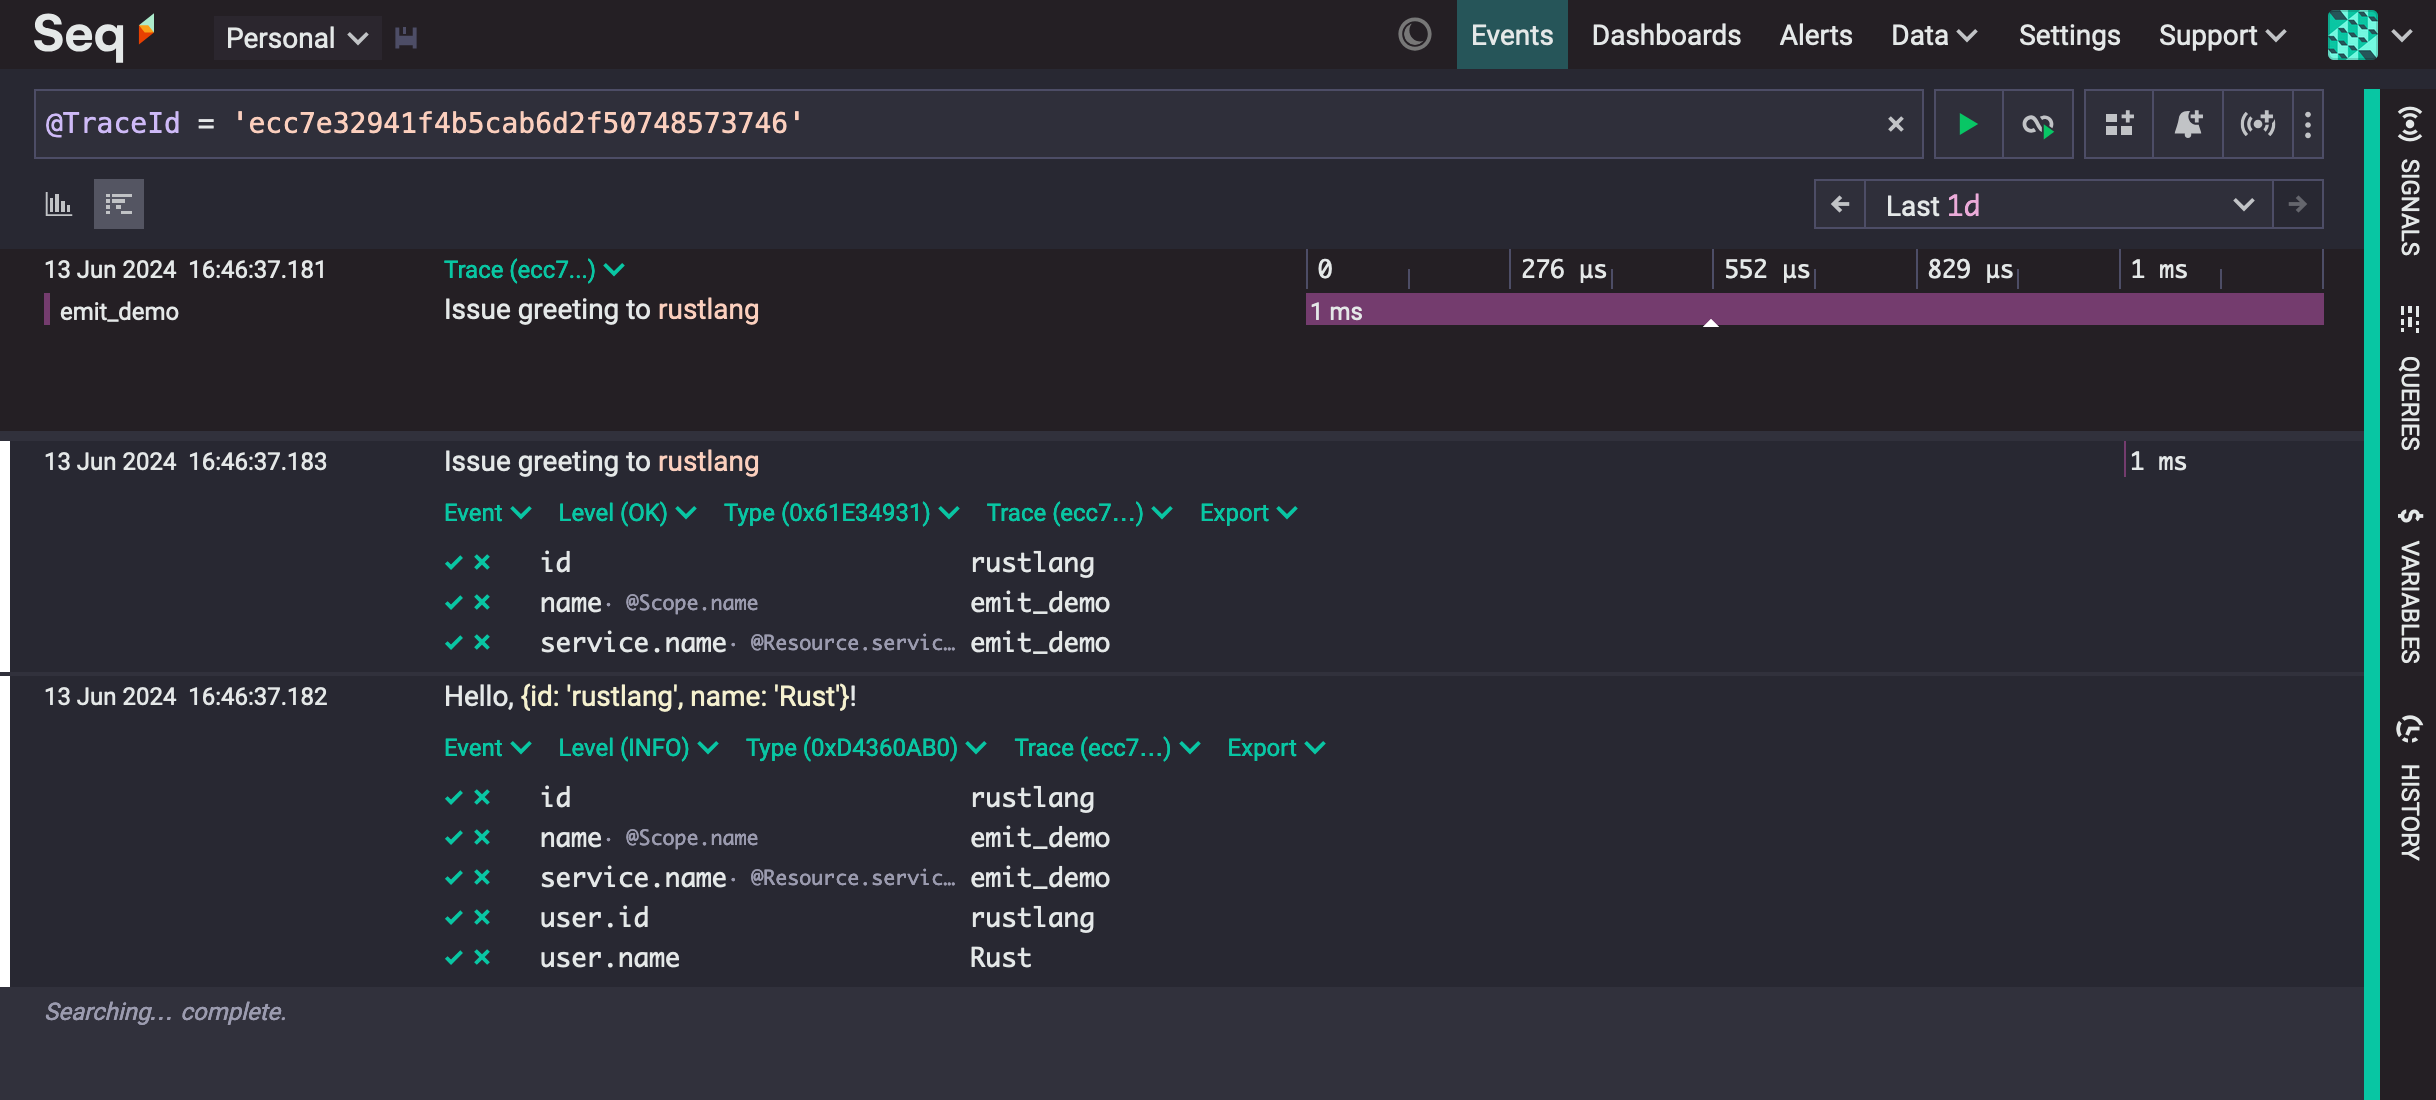
Sending that OTLP output to Seq, the diagnostics product I build at work, looks something like this:
What makes emit different?
emit makes full use of Rust’s powerful metaprogramming features to offer an expressive and robust syntax for adding diagnostics to your applications. Its message templates serve a dual role of capturing ambient state into the diagnostic event, and providing a human-readable description of it. Message templates are parsed at compile time, but are rendered at runtime, which makes the colorized output in the previous example possible.
emit supports fully structured data by inheriting the data model of fully fledged serialization frameworks, including serde. You can capture arbitrarily complex values in a diagnostic event without losing their structure. In the previous example, you’ll notice the colorization extends to the individual fields of the rendered value.
Despite its heavy use of metaprogramming, I’ve tried to ensure emit’s APIs are all usable outside of its macros too. I’m not a fan of APIs that you can’t use without companion macros so have kept everything grounded in regular Rust types.
How does this compare to log or tracing?
emit is not trying to be a replacement for the log or tracing projects. As a high-level systems language, Rust is used in many environments, each with its own microcosm of supporting libraries and tooling serving the niche requirements of its community. There’s much less winner-takes-all campaigning because there can’t ever be a single solution that perfectly serves all users and there’s no strong overarching authority to impose one anyway.
The log library is intentionally minimal. It has a few built-in pieces of metadata that are reminiscent of traditional log lines, but is otherwise mostly a configurable println!. That’s a very appealing property to some users who want to minimize the outside code they depend on. emit is not a zero-dependency framework and is not going to be appealing to these users.
The tracing library is really well suited to fine-grained diagnostics in high-throughput applications. If you have a complex, asynchronous, performance sensitive application with a lot of moving parts you need to make sense of then tracing is probably what you need. emit is not intended for these kinds of applications and is likely to introduce too much overhead.
emit is just for applications, it’s not intended to be used by libraries. In general, libraries shouldn’t really log anyway, but components with non-trivial runtime state like HTTP clients do benefit from it.
How do I get started?
Check out the GitHub repository for instructions on getting started.
I also maintain a little rocket-based sample web application that I’ve added emit to. It gives you an idea of how it can be integrated into a more real-world application.
Where to from here?
I think emit is a great addition to the suite of options for the Rust developer looking to add diagnostics to their applications. It pushes Rust’s unique language features further than any diagnostic framework before it. It’s still alpha-level software though. The APIs are mostly bedded down and I’ve written some basic documentation but almost no tests yet. If you’ve got an application sitting around you think could benefit from some diagnostics I’d love if you gave it a try. I’d welcome any discussion or feedback on how it goes and any feature requests.
A thank you to the giants on whose shoulders emit stands
emit itself borrows ideas from many projects that have come before it. Particularly from Serilog in the .NET ecosystem. It’s also taken inspiration from OpenTelemetry, and also from within Rust itself in log and tracing. Keeping log focused on its minimalistic mission has turned emit into a space for me to flesh out some of the more radical ideas I had without eroding log’s value to its existing users. I’ve always admired the tracing project’s professionalism in its development. They managed to build and ship something years before I could, and the thing they’ve shipped has genuinely transformed the shape of the Rust diagnostics space. I’d be delighted to see some of emit’s ideas find their way back there too.